
Tip 34: Study Confidence Regions in PhotoModeler for Point Quality
 In many measurement tasks one needs to understand how well the positions of 3D points are known; or how confident one can be in their computed positions. Mathematically this confidence is defined by the point’s precision (or standard deviation).
An estimate of photogrammetric precision is computed by PhotoModeler’s bundle adjustment algorithm when it solves the points’ positions in space. The precision is a 3D vector quantity that can be hard to understand in tabular form. PhotoModeler’s 3D Viewer has a great tool called ‘Confidence Regions’ to help with that. After processing, the Confidence Region display shows the iso-surface of one sigma precision for each point. They look like little blobs, spheres or ellipsoids.
If a point is equally precise in all directions (the probability of where it should be is even in all coordinate axes) then the confidence region is a sphere. If the confidence in position is worse in a particular direction then the confidence region is an ellipsoid. In a high quality project the one sigma surfaces are so small you can’t see them – so PhotoModeler’s 3D Viewer allows you to apply a scale factor to make them visible.
The shape, direction and relative size of the Confidence Region’s ellipsoid is helpful to determine how confident you can be in the point. The terms ‘precision’, ‘one sigma’, ‘iso-surface’ and ‘standard deviation’ may or may not be familiar to you, but the use of the Confidence Regions and the visual feedback they provide is very easy to grasp. The bigger the shape, the lower the confidence or the lower the precision.
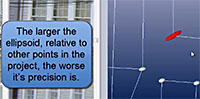
The image on the left show one Confidence Region selected in red – it is quite elongated. This means the confidence of the point’s true position is low in that elongated direction. Think of the point ‘rattling around inside that shape’.
Here is one example of where this might be very useful to know. Let’s say you had two points you were using for scale (e.g. the points that you set to be 38.23cm apart to define the overall size and dimensions for future measurements). And further suppose that the confidence regions where large for those points or large in the direction of the scale (e.g. the two points’ ellipsoid’s elongated directions where pointing at each other). This means we are not confident of the positions of those two points and as a result the scale is not dependable either.
If accuracy is important in your project, you may find the Confidence Region display in PhotoModeler’s 3D Viewer to be a very useful tool. Take a look at the video to learn more -view the Youtube version for higher resolution.